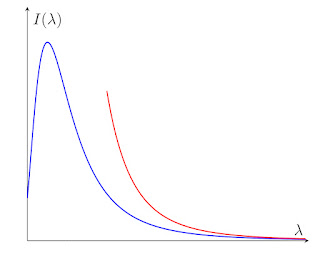
Blue curve is the blackbody radiation spectrum as a function of photon wavelength λ derived from the Planck’ prediction with
I(λ) = 2hc^2 λ^{−5} /(exp[ hc/λkT ] − 1).
It is related to the blackbody radiation spectrum as a function of photon frequency ν
I(ν) = 2hν^3c^{−2}/ (exp[ hν/kT ] − 1)
via the identity I(ν)dν = −I(λ)dλ.
Red curve is the Raleigh-Jeans prediction I = 2ckT/λ^4 that agrees very well with the Planck’s prediction at large wavelength limit.
\documentclass{scrbook}
\usepackage{pgfplots}
\begin{document}
\begin{center}
\begin{tikzpicture}
\begin{axis}[ticks=none, %title={blackbody radiation spectrum},
axis lines=middle,
xmax=1.516,
xmin=0.1,
ymin=0,
ymax=25,
xlabel=$\lambda$,
ylabel={$I(\lambda)$},
]
\addplot [domain=0.1:1.5, samples=1000, thick, blue] {1/(x^5*((exp(1/x)-1)))}; %{9*exp(x)/(exp(x)+9)^2};
\addplot [domain=0.5:1.5, samples=1000, thick, red] {1/(x^4)};
\end{axis}
\end{tikzpicture}
\end{center}
%set h=c=k=1.
\textcolor{blue}{Blue curve }is the blackbody radiation spectrum as a function of photon wavelength $\lambda$ derived from the Planck' prediction with
$$I(\lambda)={2hc^2\lambda^{-5} \over \exp [ ~ hc/\lambda kT~]-1}.$$
It is related to the blackbody radiation spectrum as a function of photon frequency $\nu$
$$I(\nu)={2h\nu^3c^{-2} \over \exp [ ~ h\nu/ kT~]-1}$$
via the identity $I(\nu) d\nu=-I(\lambda)d \lambda.$
\textcolor{red}{Red curve} is the Raleigh-Jeans prediction $I= 2ckT/\lambda^4$ that agrees very well with the Planck's prediction at large wavelength limit.
\end{document}